RV Roamer said:
Yes, but there are a couple big assumptions in there related to mileage and mileage is a critical component of the calculation. It's the divisor in the equation and you don't have to tweak the divisor much to substantially alter the calculated fatality index
Gary,
I am comfortable that the denominator derived from the National Household Transportation Survey data is in fact accurate for the survey year.
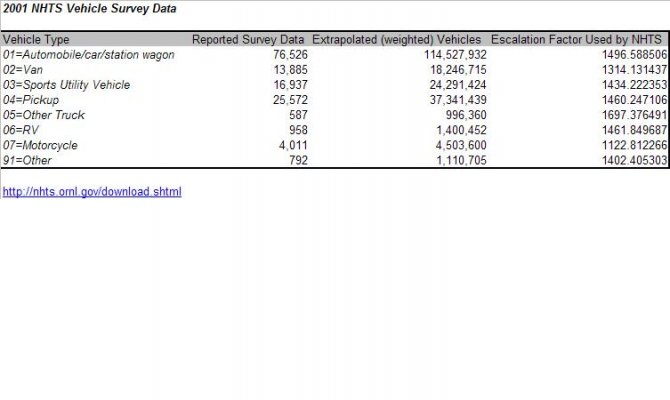
The 2001 survey had 139,000 responses. Of those responses 958 reported driving or owning a motorhome or "motorized" RV. The NHTS corrects for certain demographic factors in the response pool and generates an "escalation factor", which is just a multiplier used to normalize the number of survey responses for the entire U.S. population (see table below). When that was done, the estimated number of motorhomes in the U.S. comes out to 1,400,452 in 2001. The RVIA reports total RV (non-motorized included) ownership in the U.S. in 2001 at around 7,000,000. RVIA Sales reports show that the typical ratio is 20-25% motorhomes sold to 75-80% non-motorized RV's (rough average). This ratio supports the NHTS number since 20-25% of 7,000,000 would be 1.4 to 1.75 Million, consistent with the reported NHTS data.
Each household in the survey also reported the number of miles driven by each vehicle. Motorhomes were reported as being driven an average of 4,268 miles per year, and that includes a large number of responses that listed 0 miles.
Taking the product of the average miles driven and the number of motorhomes results in a total number of miles driven by motorhomes in the U.S. in 2001 of 5,977,129,136, which is the denominator in our fatality rate equation.
Given the strength of the NHTS data, I am highly confident of the 2001 mileage information. Where the soundness of the data becomes less certain is when you extrapolate out for years 2000 and 2002-2006. I assumed that motorhome miles driven would correlate with the number of miles driven for large, single unit, heavy trucks with 6 wheels or more since that is a category tracked by the Bureau of Transportation Statistics for each year. I believe that assumption is reasonable, but you could argue that linking motorhome miles to that category would UNDER-report miles driven since motorhome have become more popular in the last 5 years. Regardless, the impact on the result will be very small (less than 5% at most).
Anyway, sorry for the long post, I just want to be transparent in the assumptions. I have significant revisions to discuss in my next post since I discovered some problems with the actual fatality listings last night. More soon.
Christian
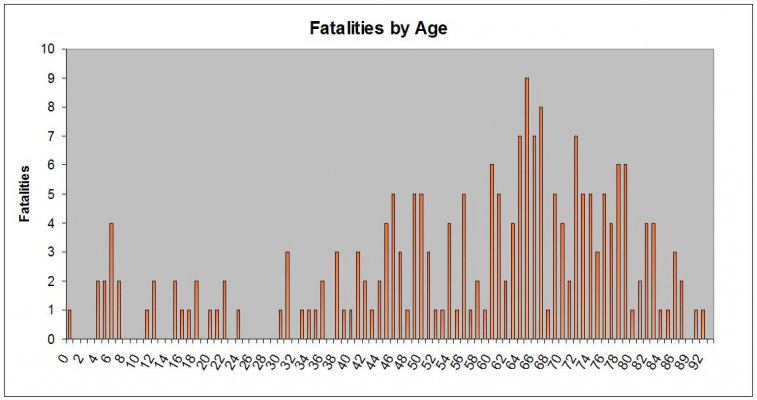
") ), with a clear concentration around the 60's, which would support the retiree's theory. See Chart "Fatalities by Age" below.
), with a clear concentration around the 60's, which would support the retiree's theory. See Chart "Fatalities by Age" below.